Airlie Beach Tides
Airlie Beach tide times for today and the week ahead, from the official Shute Harbour tide predictions, plus the best low tide days to see the Hill Inlet swirling sands.


Airlie Beach Tides Today
Today's tides load here. The full tide tables are further down the page.
Heights are metres above Lowest Astronomical Tide (LAT). The curve is drawn between the predicted highs and lows. Times are Australian Eastern Standard Time (UTC+10). Queensland has no daylight saving.
Predictions, not live readings. Wind, air pressure and storm surge can move the real water level above or below these heights. Not for navigation: boaties should use official tide tables and local knowledge.
Sun and moon today
Times for Airlie Beach today in AEST (UTC+10), worked out from the sun and moon position for the town. First light and last light are the start and end of civil twilight.
Airlie Beach Tide Times For The Next 7 Days
| Date | Tide | Tide | Tide | Tide |
|---|---|---|---|---|
| The next 7 days load here. See the full tide tables below. | ||||
Best Low Tides For The Hill Inlet Swirling Sands
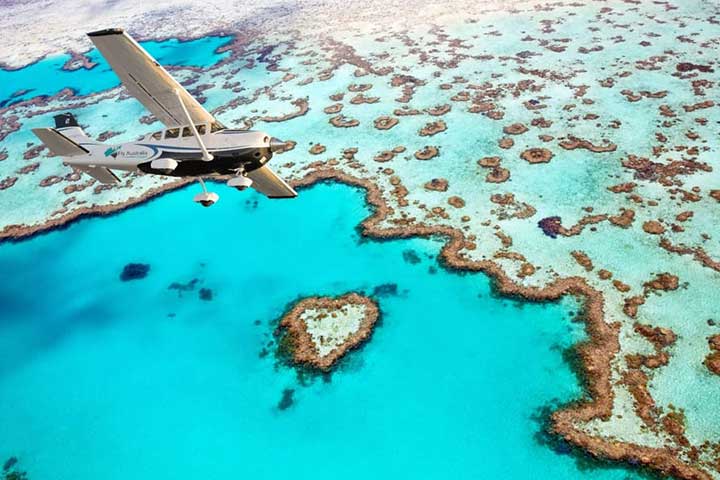
The swirling sands at Hill Inlet show best at low tide, when the most sand is exposed. These are the days with a low tide between 9am and 3pm, when tours and scenic flights are out. The lower the tide, the more sand you see.
| Date | Low tide | Height |
|---|---|---|
| Sun 1 Nov | 9:30am | 1.03 m |
| Mon 2 Nov | 10:58am | 0.97 m |
| Tue 3 Nov | 12:10pm | 0.86 m Low |
| Wed 4 Nov | 1:11pm | 0.78 m Low |
| Thu 5 Nov | 2:03pm | 0.76 m Low |
| Fri 6 Nov | 2:48pm | 0.79 m Low |
| Tue 17 Nov | 10:08am | 1.46 m |
| Wed 18 Nov | 11:21am | 1.37 m |
| Thu 19 Nov | 12:20pm | 1.24 m |
| Fri 20 Nov | 1:11pm | 1.11 m |
| Sat 21 Nov | 2:01pm | 1.01 m |
| Sun 22 Nov | 2:51pm | 0.93 m |
| Mon 30 Nov | 9:06am | 1.00 m |
| Tue 1 Dec | 10:28am | 1.08 m |
| Wed 2 Dec | 11:44am | 1.10 m |
| Thu 3 Dec | 12:54pm | 1.08 m |
| Fri 4 Dec | 1:54pm | 1.05 m |
| Sat 5 Dec | 2:45pm | 1.03 m |
| Thu 17 Dec | 10:15am | 1.54 m |
| Fri 18 Dec | 11:35am | 1.49 m |
| Sat 19 Dec | 12:45pm | 1.36 m |
| Sun 20 Dec | 1:51pm | 1.20 m |
| Mon 21 Dec | 2:47pm | 1.04 m |
| Wed 30 Dec | 9:50am | 1.27 m |
| Thu 31 Dec | 11:18am | 1.39 m |
Best months for low tides at Hill Inlet
The time of day the lowest tides fall shifts through the year. From November to March the lowest tides fall outside the middle of the day, so lows between 9am and 3pm stay at about 0.6 to 1 m. From May to September the lowest tides move into the middle of the day, dropping to about 0.3 m.
| Month | Lowest daytime tide | Lows of 0.60 m or less |
|---|---|---|
| January | 0.99 m | 0 |
| February | 0.85 m | 0 |
| March | 0.63 m | 0 |
| April | 0.57 m | 2 |
| May | 0.41 m | 5 |
| June | 0.27 m | 3 |
| July | 0.27 m | 3 |
| August | 0.28 m | 2 |
| September | 0.33 m | 2 |
| October | 0.49 m | 2 |
| November | 0.76 m | 0 |
| December | 1.03 m | 0 |
Daytime means 9am to 3pm. Worked out from the 2026 Shute Harbour predictions. The same seasonal pattern repeats each year.
Times are for Shute Harbour. Tides at Hill Inlet, on the far side of Whitsunday Island, will not run to exactly the same minute, so use these as a guide. Most boat tours reach the lookout around mid tide whatever the day, and Ocean Rafting is the only operator that can enter the inlet at all tides. A scenic flight is the best way to time a visit for low tide.
Airlie Beach Tide Tables 2026
Every predicted high and low tide at Shute Harbour for the rest of 2026. Today is highlighted and past days are faded.
November 2026
| Date | Tide | Tide | Tide | Tide |
|---|---|---|---|---|
| Sun 1 Nov | High4:01am 2.21 m | Low9:30am 1.03 m | High4:27pm 3.43 m | Low11:24pm 0.78 m |
| Mon 2 Nov | High5:21am 2.46 m | Low10:58am 0.97 m | High5:37pm 3.52 m | |
| Tue 3 Nov | Low12:23am 0.58 m | High6:27am 2.76 m | Low12:10pm 0.86 m | High6:38pm 3.57 m |
| Wed 4 Nov | Low1:12am 0.43 m | High7:23am 3.03 m | Low1:11pm 0.78 m | High7:28pm 3.54 m |
| Thu 5 Nov | Low1:54am 0.36 m | High8:09am 3.25 m | Low2:03pm 0.76 m | High8:12pm 3.42 m |
| Fri 6 Nov | Low2:29am 0.35 m | High8:51am 3.40 m | Low2:48pm 0.79 m | High8:50pm 3.25 m |
| Sat 7 Nov | Low3:00am 0.37 m | High9:29am 3.51 m | Low3:30pm 0.85 m | High9:26pm 3.04 m |
| Sun 8 Nov | Low3:28am 0.41 m | High10:03am 3.56 m | Low4:12pm 0.93 m | High9:59pm 2.83 m |
| Mon 9 Nov | Low3:55am 0.48 m | High10:37am 3.57 m | Low4:52pm 1.02 m | High10:33pm 2.61 m |
| Tue 10 Nov | Low4:22am 0.59 m | High11:10am 3.51 m | Low5:33pm 1.12 m | High11:04pm 2.41 m |
| Wed 11 Nov | Low4:45am 0.72 m | High11:41am 3.41 m | Low6:15pm 1.23 m | High11:35pm 2.23 m |
| Thu 12 Nov | Low5:11am 0.86 m | High12:14pm 3.27 m | Low6:59pm 1.33 m | |
| Fri 13 Nov | High12:08am 2.08 m | Low5:39am 1.01 m | High12:50pm 3.13 m | Low7:53pm 1.41 m |
| Sat 14 Nov | High12:55am 1.97 m | Low6:15am 1.18 m | High1:33pm 2.99 m | Low9:05pm 1.42 m |
| Sun 15 Nov | High2:00am 1.91 m | Low7:18am 1.34 m | High2:32pm 2.89 m | Low10:20pm 1.35 m |
| Mon 16 Nov | High3:38am 1.95 m | Low8:40am 1.46 m | High3:45pm 2.87 m | Low11:13pm 1.21 m |
| Tue 17 Nov | High5:00am 2.13 m | Low10:08am 1.46 m | High4:55pm 2.94 m | Low11:56pm 1.03 m |
| Wed 18 Nov | High5:57am 2.38 m | Low11:21am 1.37 m | High5:45pm 3.04 m | |
| Thu 19 Nov | Low12:33am 0.84 m | High6:45am 2.67 m | Low12:20pm 1.24 m | High6:33pm 3.11 m |
| Fri 20 Nov | Low1:08am 0.66 m | High7:28am 2.97 m | Low1:11pm 1.11 m | High7:14pm 3.13 m |
| Sat 21 Nov | Low1:42am 0.51 m | High8:09am 3.25 m | Low2:01pm 1.01 m | High7:55pm 3.09 m |
| Sun 22 Nov | Low2:14am 0.40 m | High8:51am 3.51 m | Low2:51pm 0.93 m | High8:37pm 3.00 m |
| Mon 23 Nov | Low2:46am 0.31 m | High9:33am 3.74 m | Low3:41pm 0.87 m | High9:22pm 2.89 m |
| Tue 24 Nov | Low3:23am 0.26 m | High10:16am 3.91 m | Low4:32pm 0.84 m | High10:10pm 2.75 m |
| Wed 25 Nov | Low4:04am 0.26 m | High11:01am 4.01 m | Low5:26pm 0.83 m | High11:04pm 2.61 m |
| Thu 26 Nov | Low4:52am 0.33 m | High11:48am 4.02 m | Low6:22pm 0.85 m | |
| Fri 27 Nov | High12:01am 2.48 m | Low5:44am 0.46 m | High12:40pm 3.94 m | Low7:25pm 0.88 m |
| Sat 28 Nov | High1:03am 2.37 m | Low6:42am 0.64 m | High1:37pm 3.80 m | Low8:38pm 0.88 m |
| Sun 29 Nov | High2:15am 2.34 m | Low7:46am 0.83 m | High2:42pm 3.65 m | Low9:46pm 0.82 m |
| Mon 30 Nov | High3:36am 2.43 m | Low9:06am 1.00 m | High3:52pm 3.53 m | Low10:47pm 0.72 m |
December 2026
| Date | Tide | Tide | Tide | Tide |
|---|---|---|---|---|
| Tue 1 Dec | High4:49am 2.61 m | Low10:28am 1.08 m | High4:58pm 3.43 m | Low11:42pm 0.61 m |
| Wed 2 Dec | High5:59am 2.86 m | Low11:44am 1.10 m | High6:00pm 3.32 m | |
| Thu 3 Dec | Low12:34am 0.51 m | High6:59am 3.13 m | Low12:54pm 1.08 m | High6:56pm 3.20 m |
| Fri 4 Dec | Low1:19am 0.46 m | High7:50am 3.36 m | Low1:54pm 1.05 m | High7:46pm 3.05 m |
| Sat 5 Dec | Low1:58am 0.45 m | High8:34am 3.53 m | Low2:45pm 1.03 m | High8:29pm 2.89 m |
| Sun 6 Dec | Low2:33am 0.47 m | High9:14am 3.64 m | Low3:30pm 1.02 m | High9:08pm 2.73 m |
| Mon 7 Dec | Low3:05am 0.52 m | High9:49am 3.69 m | Low4:10pm 1.03 m | High9:45pm 2.59 m |
| Tue 8 Dec | Low3:33am 0.58 m | High10:22am 3.68 m | Low4:48pm 1.07 m | High10:18pm 2.47 m |
| Wed 9 Dec | Low4:01am 0.65 m | High10:52am 3.62 m | Low5:25pm 1.12 m | High10:48pm 2.37 m |
| Thu 10 Dec | Low4:28am 0.73 m | High11:23am 3.54 m | Low5:59pm 1.19 m | High11:19pm 2.30 m |
| Fri 11 Dec | Low4:54am 0.81 m | High11:53am 3.45 m | Low6:35pm 1.25 m | High11:53pm 2.24 m |
| Sat 12 Dec | Low5:25am 0.91 m | High12:26pm 3.36 m | Low7:14pm 1.30 m | |
| Sun 13 Dec | High12:33am 2.19 m | Low6:05am 1.03 m | High1:03pm 3.25 m | Low7:58pm 1.33 m |
| Mon 14 Dec | High1:21am 2.16 m | Low6:45am 1.17 m | High1:45pm 3.14 m | Low8:52pm 1.32 m |
| Tue 15 Dec | High2:23am 2.15 m | Low7:38am 1.34 m | High2:33pm 3.04 m | Low9:50pm 1.25 m |
| Wed 16 Dec | High3:35am 2.22 m | Low8:48am 1.48 m | High3:31pm 2.96 m | Low10:43pm 1.12 m |
| Thu 17 Dec | High4:50am 2.41 m | Low10:15am 1.54 m | High4:37pm 2.91 m | Low11:32pm 0.95 m |
| Fri 18 Dec | High5:57am 2.70 m | Low11:35am 1.49 m | High5:38pm 2.89 m | |
| Sat 19 Dec | Low12:15am 0.77 m | High6:54am 3.04 m | Low12:45pm 1.36 m | High6:32pm 2.87 m |
| Sun 20 Dec | Low12:59am 0.61 m | High7:45am 3.38 m | Low1:51pm 1.20 m | High7:26pm 2.84 m |
| Mon 21 Dec | Low1:41am 0.46 m | High8:32am 3.69 m | Low2:47pm 1.04 m | High8:18pm 2.80 m |
| Tue 22 Dec | Low2:22am 0.35 m | High9:18am 3.95 m | Low3:40pm 0.90 m | High9:12pm 2.77 m |
| Wed 23 Dec | Low3:08am 0.26 m | High10:04am 4.15 m | Low4:30pm 0.80 m | High10:06pm 2.74 m |
| Thu 24 Dec | Low3:55am 0.21 m | High10:50am 4.27 m | Low5:20pm 0.73 m | High10:59pm 2.72 m |
| Fri 25 Dec | Low4:46am 0.23 m | High11:38am 4.29 m | Low6:12pm 0.72 m | High11:54pm 2.69 m |
| Sat 26 Dec | Low5:38am 0.33 m | High12:26pm 4.19 m | Low7:05pm 0.74 m | |
| Sun 27 Dec | High12:50am 2.66 m | Low6:31am 0.51 m | High1:17pm 4.01 m | Low8:03pm 0.77 m |
| Mon 28 Dec | High1:50am 2.64 m | Low7:26am 0.76 m | High2:10pm 3.75 m | Low9:01pm 0.80 m |
| Tue 29 Dec | High2:58am 2.66 m | Low8:30am 1.04 m | High3:08pm 3.47 m | Low9:59pm 0.80 m |
| Wed 30 Dec | High4:09am 2.75 m | Low9:50am 1.27 m | High4:11pm 3.19 m | Low10:56pm 0.78 m |
| Thu 31 Dec | High5:23am 2.91 m | Low11:18am 1.39 m | High5:18pm 2.97 m |
2027 predictions are added once Maritime Safety Queensland publishes them as open data, usually in December.
Whitsundays Tide Facts
| Fact | Detail |
|---|---|
| Tide station | Shute Harbour (station 030003A), 20°17′S 148°47′E, the official tide prediction point nearest Airlie Beach. |
| Tides a day | Two highs and two lows on most days. In 2026, 340 days had two low tides and 25 days had one. |
| Tidal range | The daily range in 2026 runs from 1.21 m on the smallest neap tides to 4.14 m on the biggest spring tides. A typical day is about 2.8 m. |
| Highest tide of 2026 | 4.30 m at 10:38am on 3 January |
| Lowest tide of 2026 | 0.13 m at 4:15pm on 14 July |
| Average high and low | Highs average 3.07 m and lows average 0.90 m |
| Biggest tides of the year | Highs of 4.25 m or more come in January, February, June, July and December |
| When the lowest tides fall | Outside the middle of the day from November to March. Between 9am and 3pm from May to September. |
| Spring and neap tides | Spring tides, with the biggest range, come around the new and full moon. Neap tides, with the smallest range, come around the first and last quarter moon. |
| Height datum | Lowest Astronomical Tide (LAT). The Australian Height Datum sits 1.907 m above it at Shute Harbour. |
| Time zone | AEST (UTC+10) all year |
Figures worked out from every 10-minute prediction for Shute Harbour in 2026.
How The Tide Affects Your Day
| Where | What the tide does |
|---|---|
| Hill Inlet | Low tide shows the most swirling sand. At high tide it is mostly water. Most tours visit around mid tide. |
| Airlie Beach foreshore | The tide goes out a long way over shallow flats at Airlie Beach. Airlie Beach Lagoon is not affected by the tide. |
| Snorkelling | Tide and wind change visibility at the fringing reefs. How tide and wind affect snorkelling |
| Live view | Watch the water in Pioneer Bay right now. Airlie Beach live cam |
Airlie Beach Tide Questions
How many tides a day does Airlie Beach have?
Usually two high tides and two low tides a day, about 6 hours apart. On some days only one low or one high falls before midnight, so the table shows three.
How big are the tides in the Whitsundays?
Big for Australia. The daily range at Shute Harbour runs from about 1.2 m on neap tides to just over 4 m on spring tides, with the highest tide of 2026 reaching 4.30 m.
When is the best tide to see Hill Inlet?
Low tide, when the most white sand is exposed and the swirls are clearest. A low tide between 9am and 3pm suits a day trip or scenic flight. Check the Hill Inlet low tide list above.
What is the best time of year to see Hill Inlet at low tide?
May to September. In those months the lowest tides fall in the middle of the day, dropping to about 0.3 m between 9am and 3pm. From November to March the lowest tides fall outside the middle of the day, so daytime lows stay at about 0.6 to 1 m.
Are the tides at Whitehaven Beach the same as Airlie Beach?
Close, but not exact. There is no tide station at Whitehaven Beach, so Shute Harbour is the nearest official prediction. Tide times on the far side of Whitsunday Island can differ.
What is the tide doing right now in Airlie Beach?
The panel at the top of this page shows whether the tide is rising or falling and when the next high or low is due, using the Shute Harbour predictions.
What is a king tide in the Whitsundays?
King tides are the highest tides of the year. At Shute Harbour they reach about 4.3 m, around early January, the middle of the year and late December.
More Whitsundays Information
Sources
Tide predictions: Shute Harbour tide gauge predicted interval data, Maritime Safety Queensland, Department of Transport and Main Roads, Queensland Government open data, licensed under Creative Commons Attribution 4.0. Highs, lows, ranges and the tide curve are worked out by Whitsunday Islands Tours from the 10-minute predictions. This product is based on Bureau of Meteorology information that has subsequently been modified. The Bureau does not necessarily support or endorse, or have any connection with, the product. Checked November 2026.